

Podcast: Play in new window | Download (Duration: 52:48 — 48.3MB)
Season 2021 – Talk 02 – US Presidential Election results from 1920 to 2020
In US Presidential Election results from 1920 to 2020 Rob Sykes tells us about the evolution of the political map of the United States in a century of elections. Because the talk makes great use of maps showing the result for each state in each election I suggest that you open the image gallery below.
Click a thumbnail below to view the image gallery that accompanies the talk.


The Electoral College:
We learn of the importance of the Electoral College in the election of the President. The number of representatives for each state is based on the population. Thus California, with a population of 39,538,223, has 54 votes (2024 and 2028) whereas Wyoming , which has a vast acreage, has a population of 576,851 and 3 votes. Therefore in California it takes 732,189 voters for each Electoral College vote whereas in Wyoming there are only 192,283 voters for the same voting power.
The states with the most Electoral College votes are:
- California, with a population density of 253.6 per square mile – 54
- Texas, with a population density of 114 per square mile – 40
- Florida – 30
- New York – 28
At the other end of the scale, each with 3 votes, are some states with a vast acreage:
- Alaska – population density of 1.26 per square mile
- Wyoming – population density of 5.97 per square mile
- North and South Dakota
As well as some physically small states:
- Vermont – population density of 67.7 per square mile
- Delaware – population density of 469 per square mile
Plus the District of Columbia, because they have the same number as the states with the smallest populations.
As you can see, a good strategist might target the states with the fewest voters for each Electoral College vote!
The popular vote:
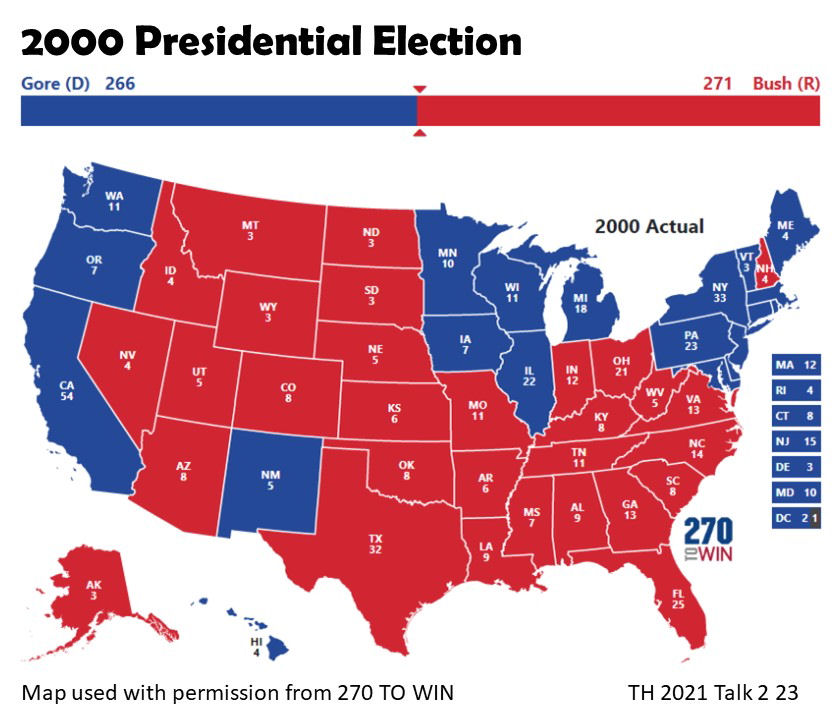
Winning the largest number of votes across the nation, known as the popular vote, does not guarantee winning the Presidency. This has happened 5 times.
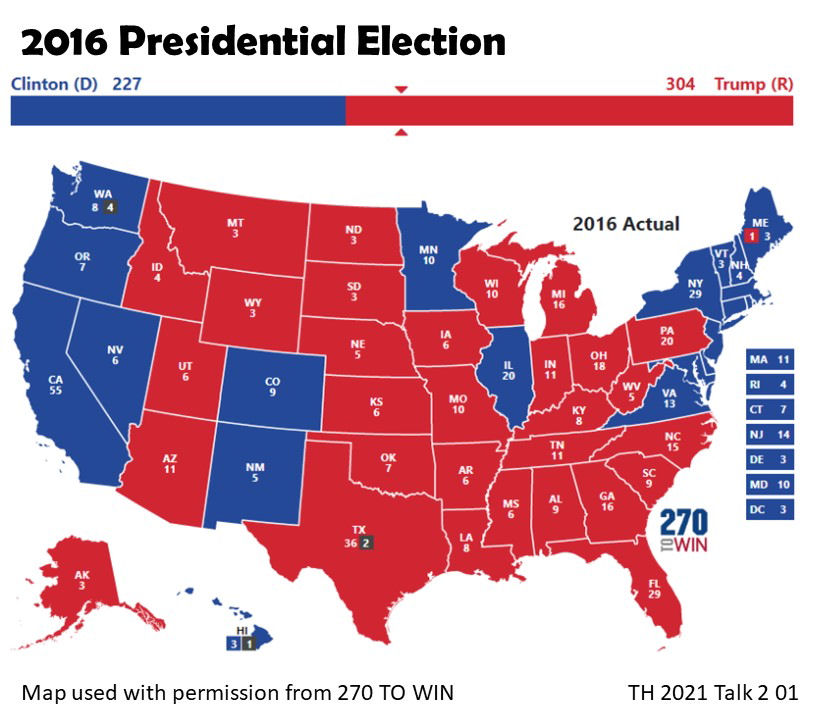
The most recent example is 2016 where Hilary Clinton receives 48.2% of the votes compared to Donald Trump who receives 46.1%. However Trump wins because he receives 77 more Electoral College votes.
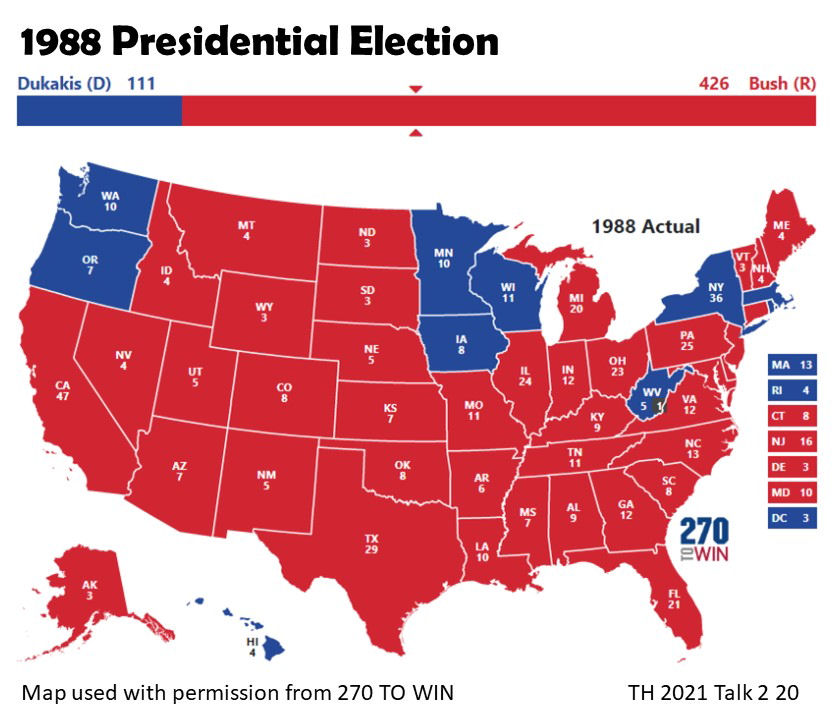
This also happens in 1824, 1876, 1888 and 2000 when Al Gore wins the popular vote but George W Bush becomes President by a margin of 5 Electoral College votes.
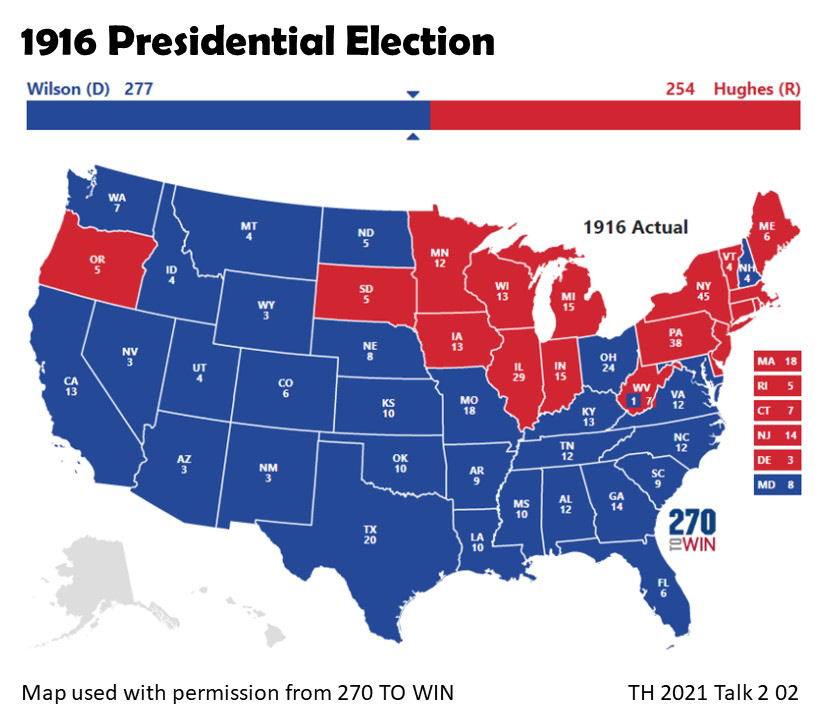
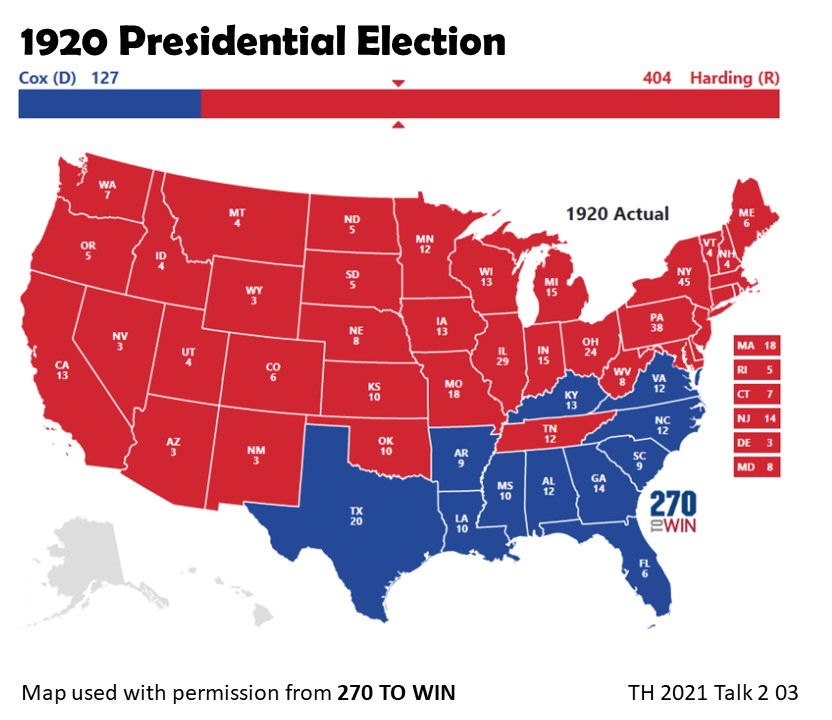
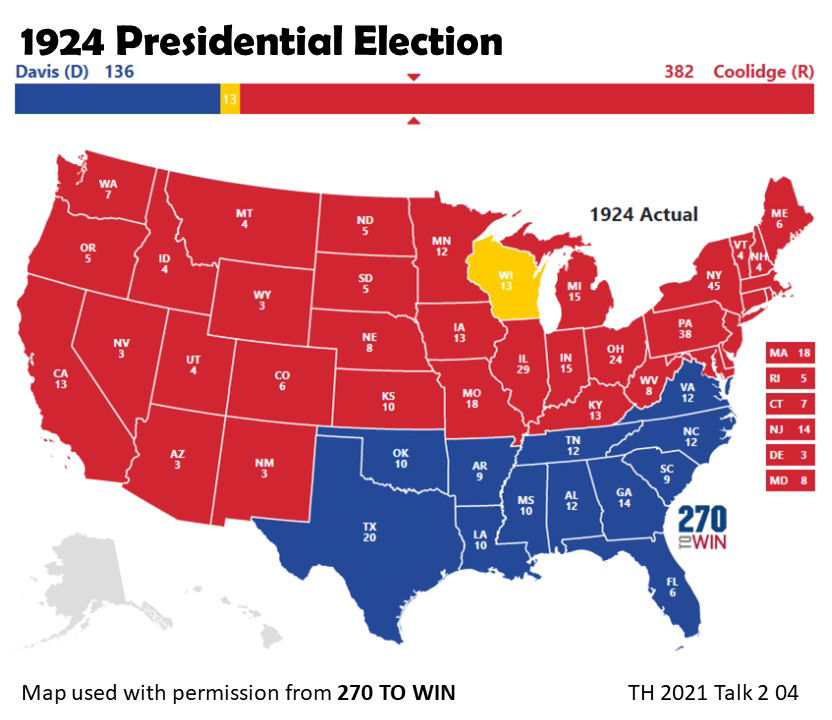
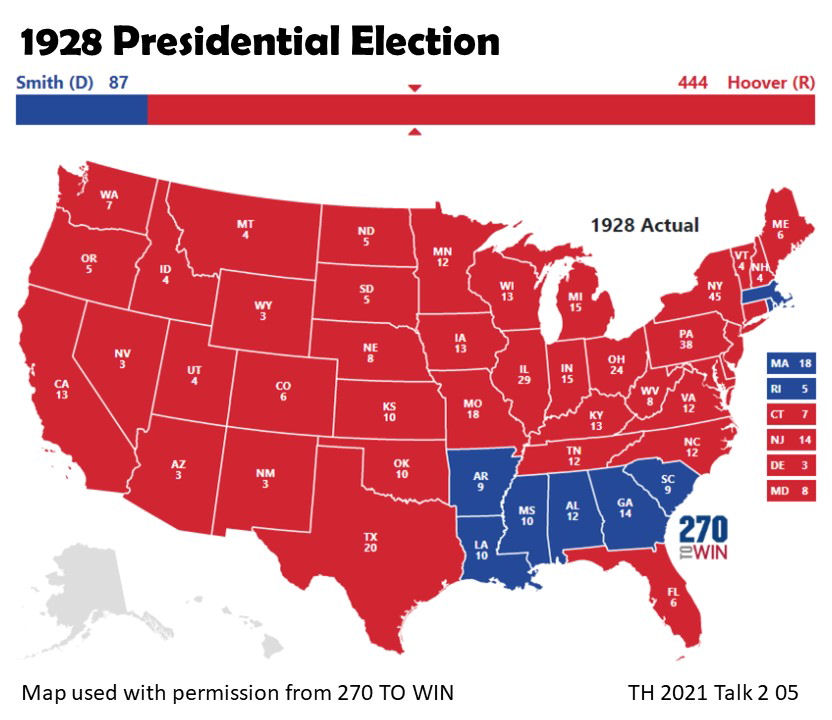
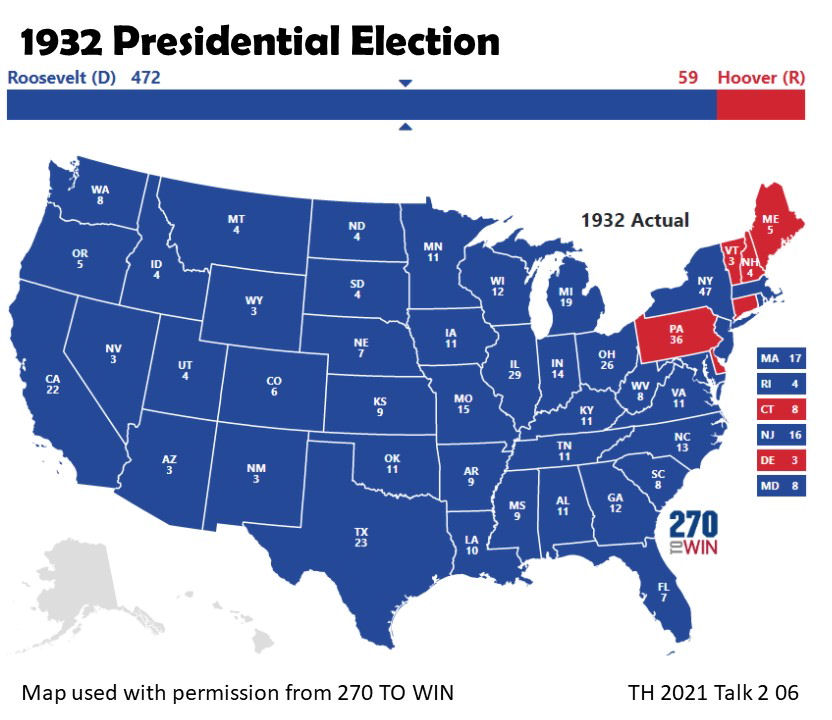
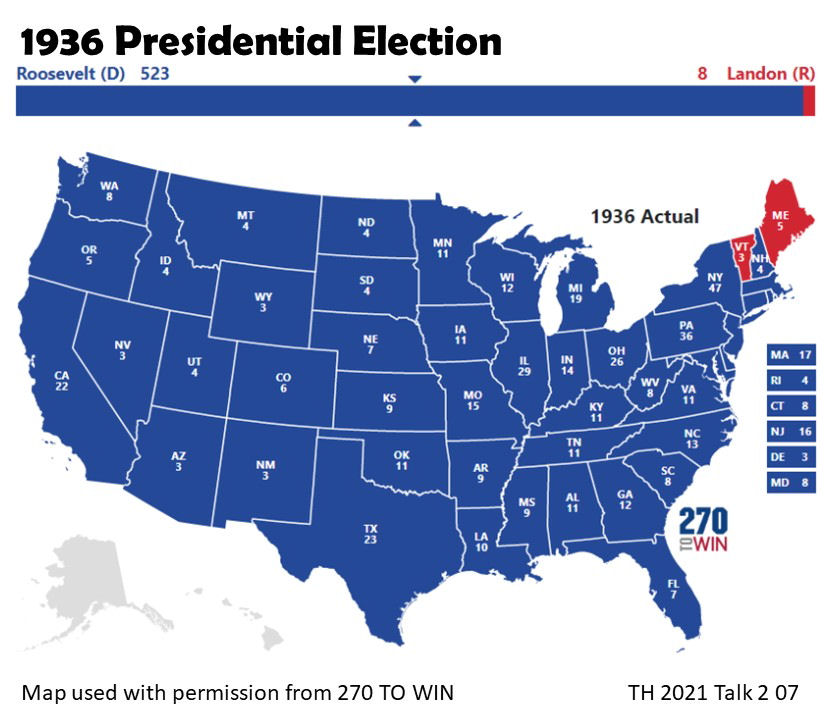
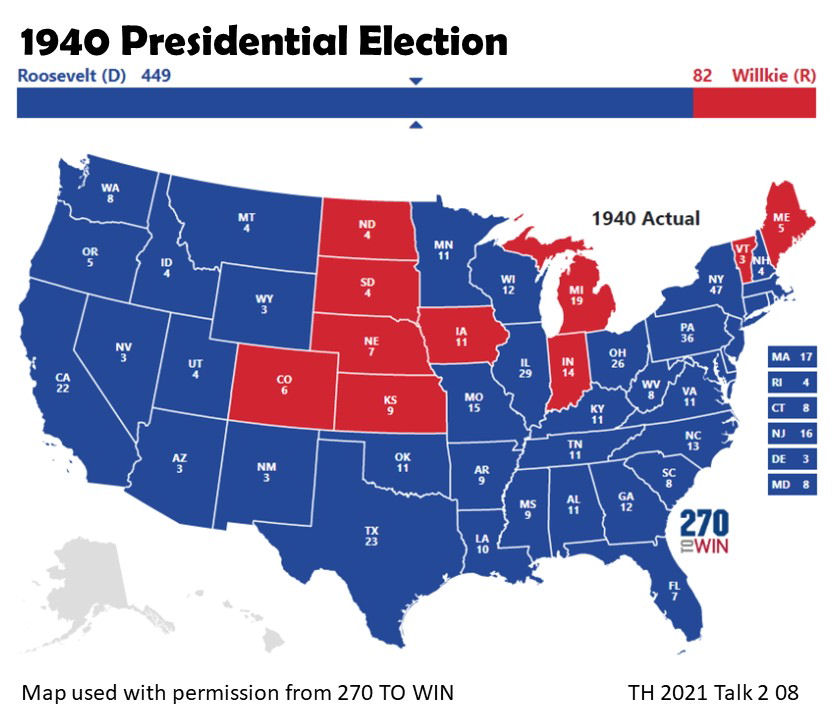
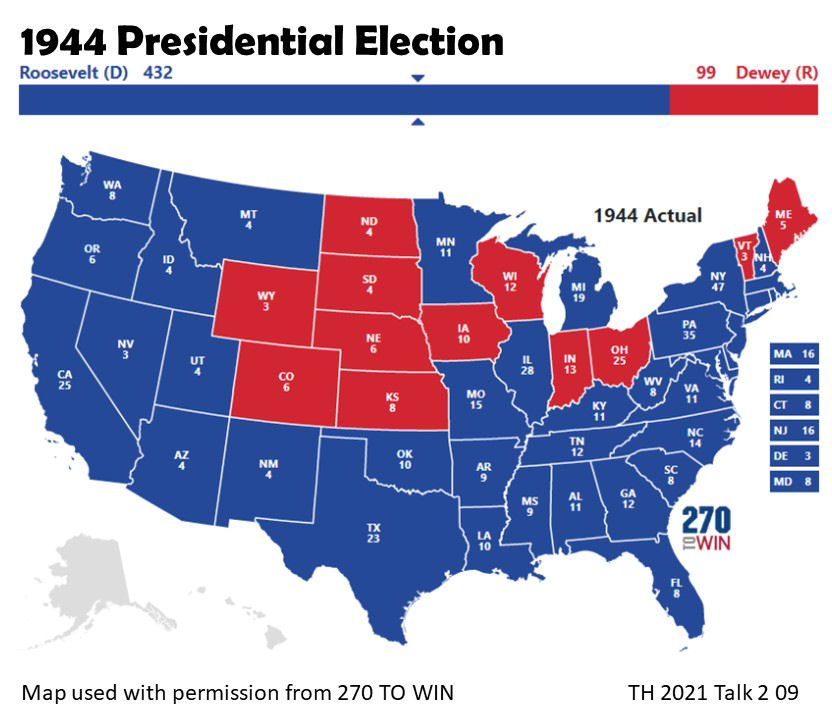
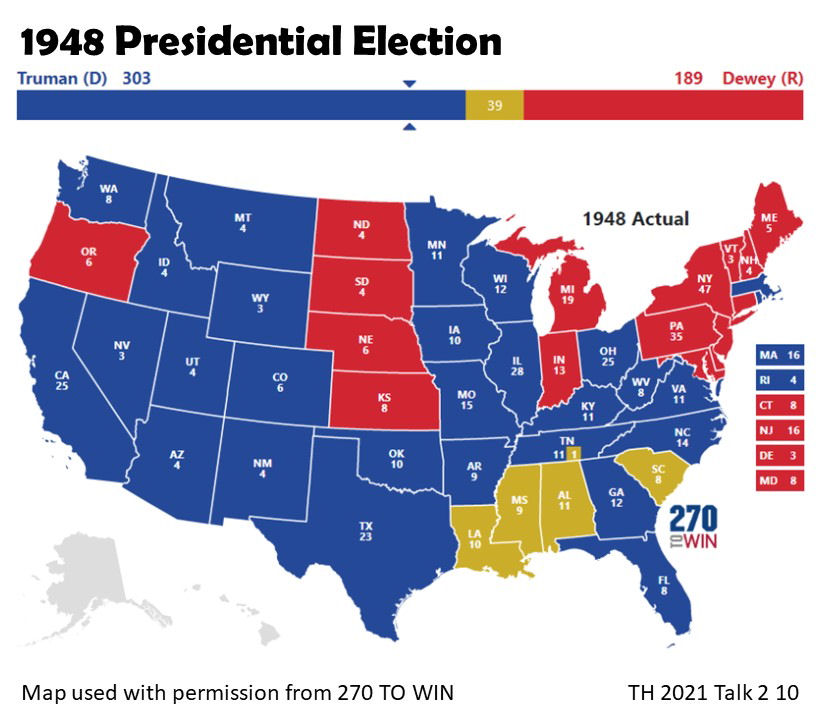
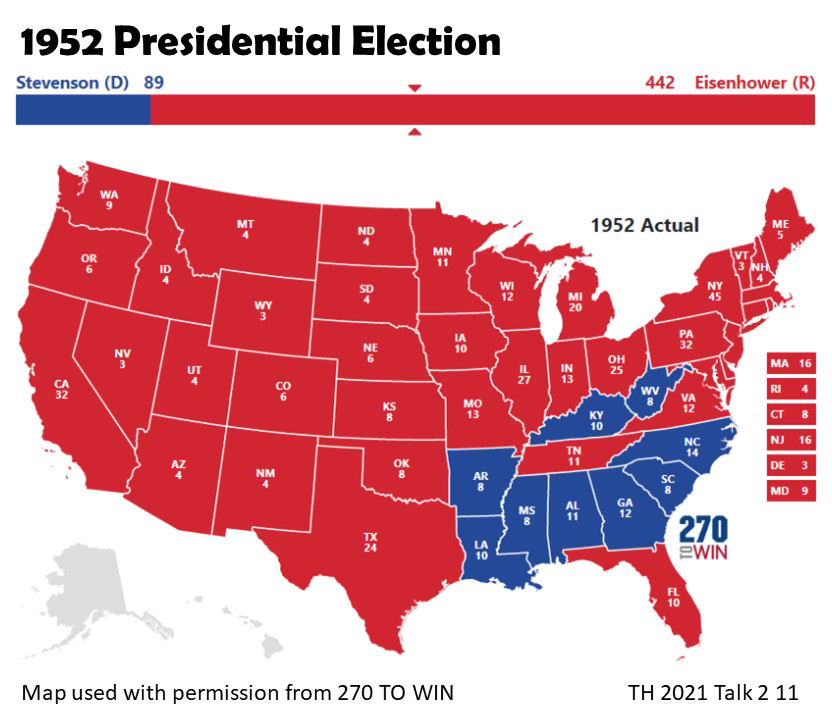
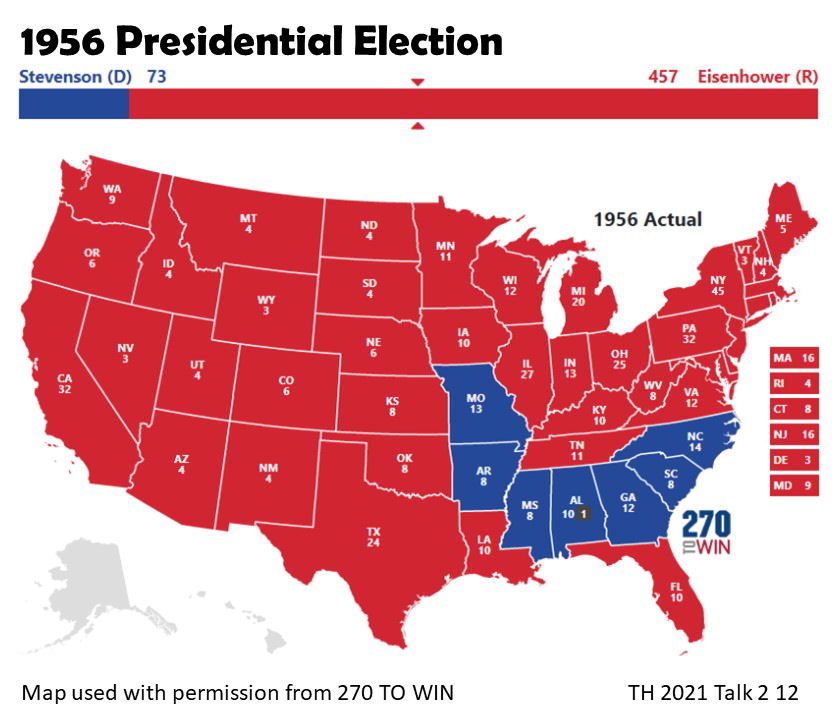
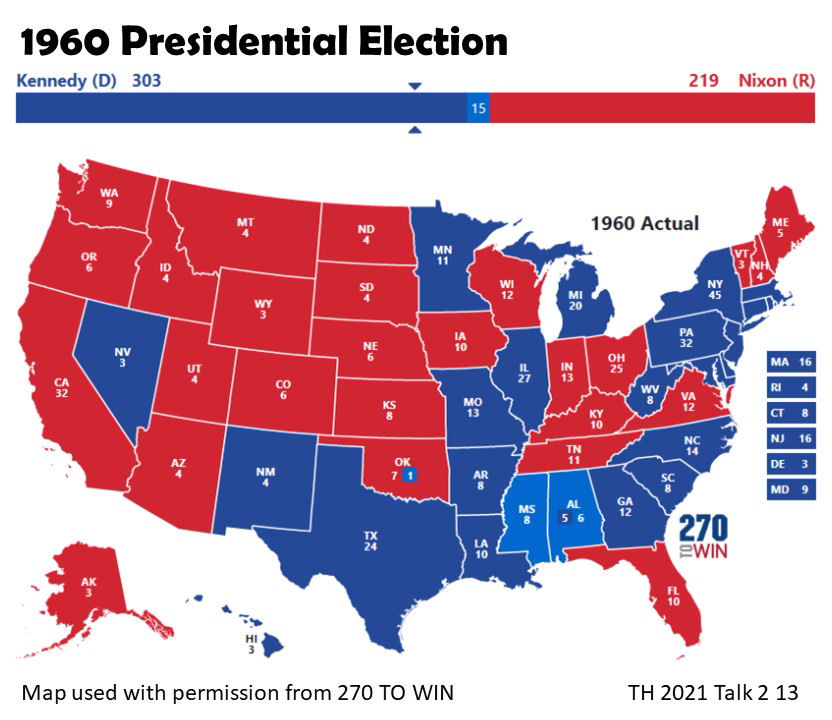
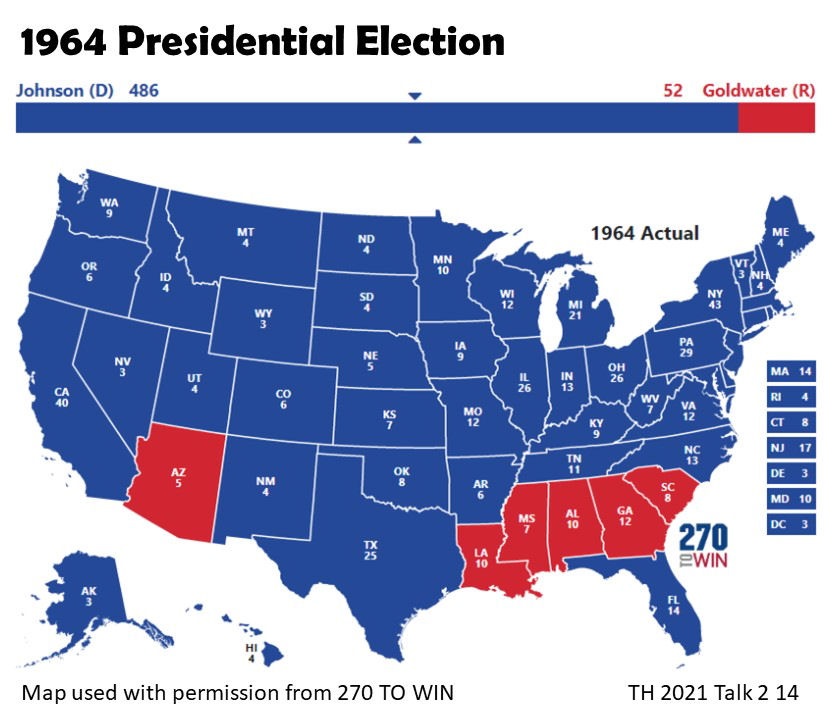
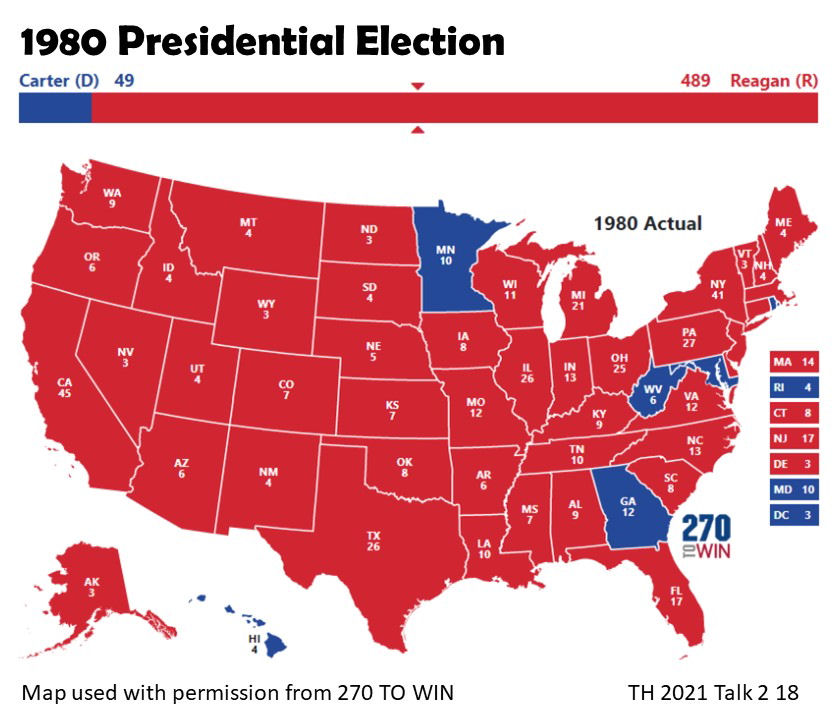
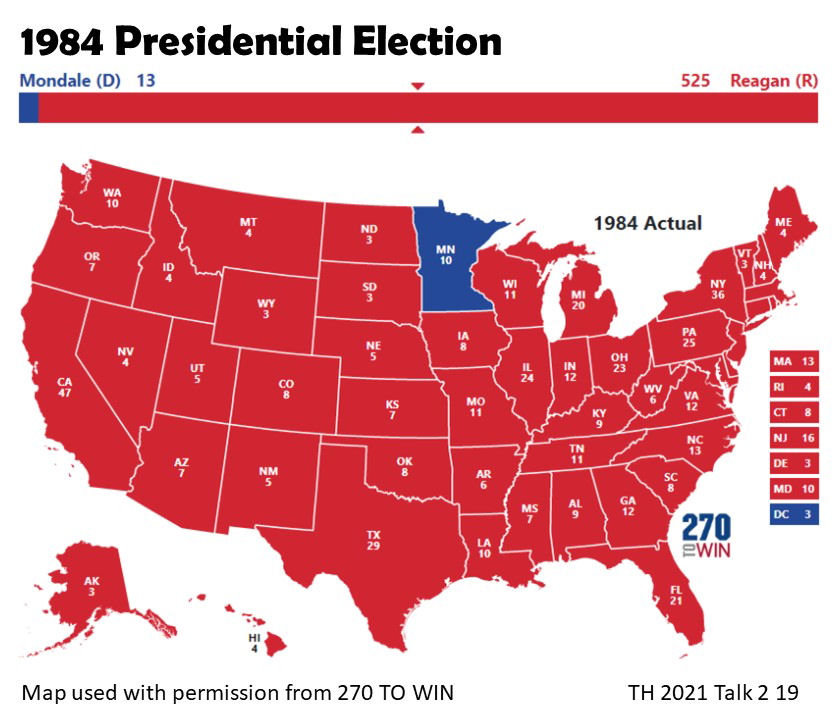
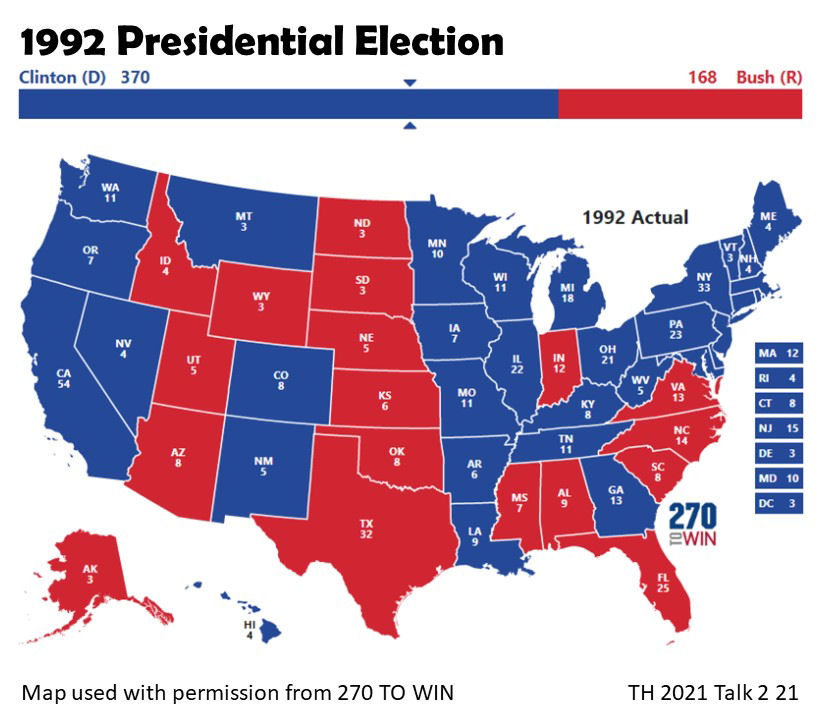
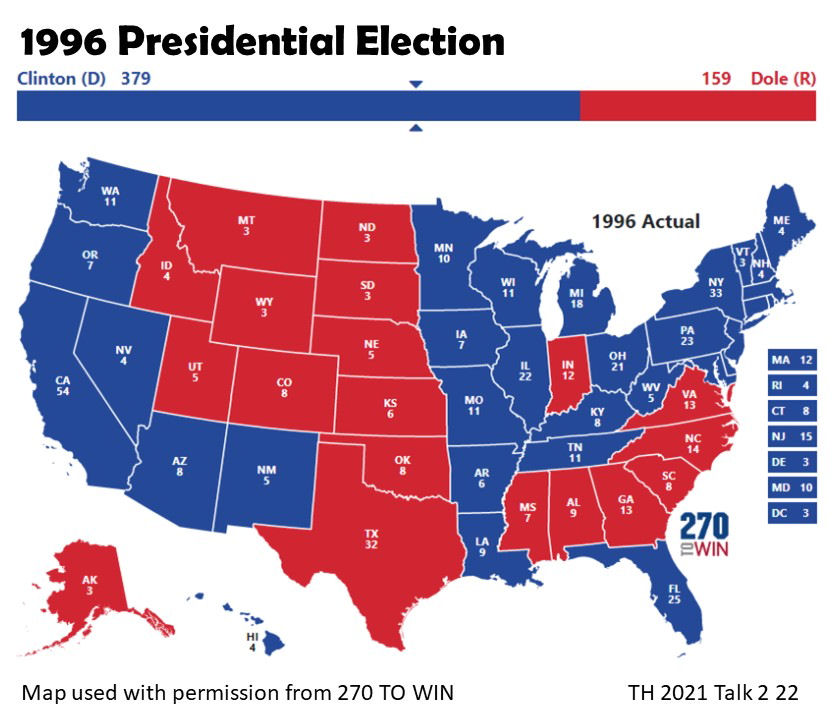
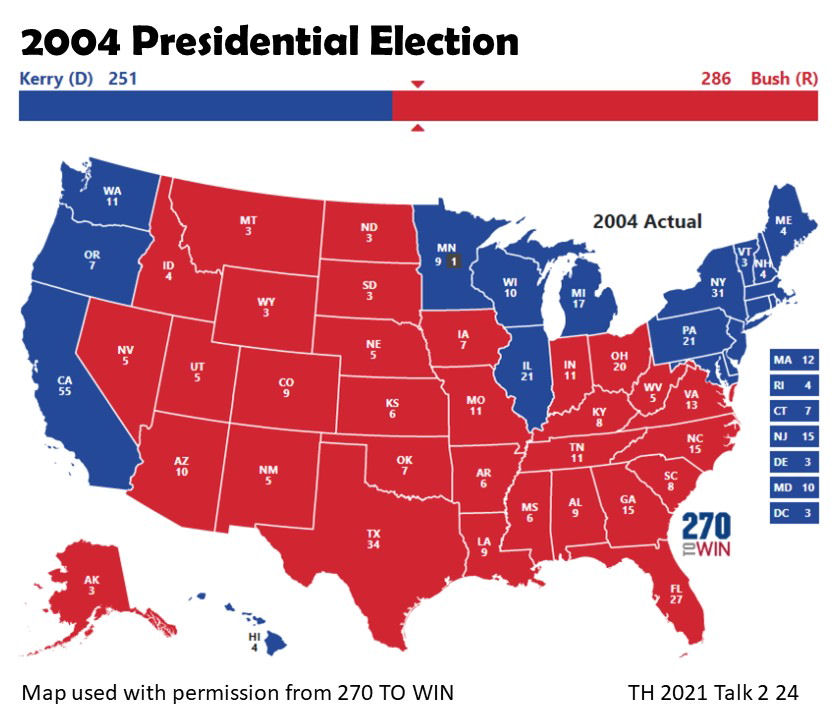
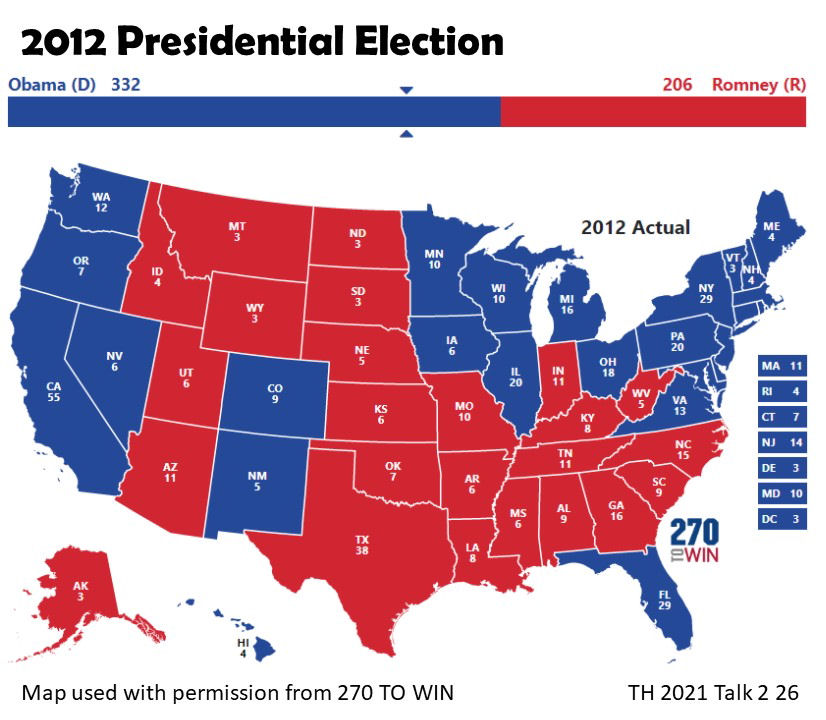
The maps:
The maps clearly show the evolution of political allegiances in the United States over the century. This is illustrated by the political change in the Southern states, where the change is from Democrat to Republican compared to California where the reverse happens.
We also learn that the winning margin in a state can be very small however no matter how small the margin the winner usually takes all the Electoral College votes.
Please note:
This podcast is a recording of a talk on Zoom and there are a few extraneous noises.
The maps are from the website ©270 to Win and are used with their permission. You can visit their website here.
About this podcast:
This podcast is an edited recording of a talk first given to the Farnham u3a World History Group.
The Farnham u3a site is found here.
This podcast is also available through Amazon Music, Apple Podcasts, Castbox , Deezer, Podchaser, Spotify, Stitcher and Vurbl and others.
AKM Music has licensed Media Magazine for use as the theme music.
© The MrT Podcast Studio and Farnham u3a World History Group 2018 – 2021